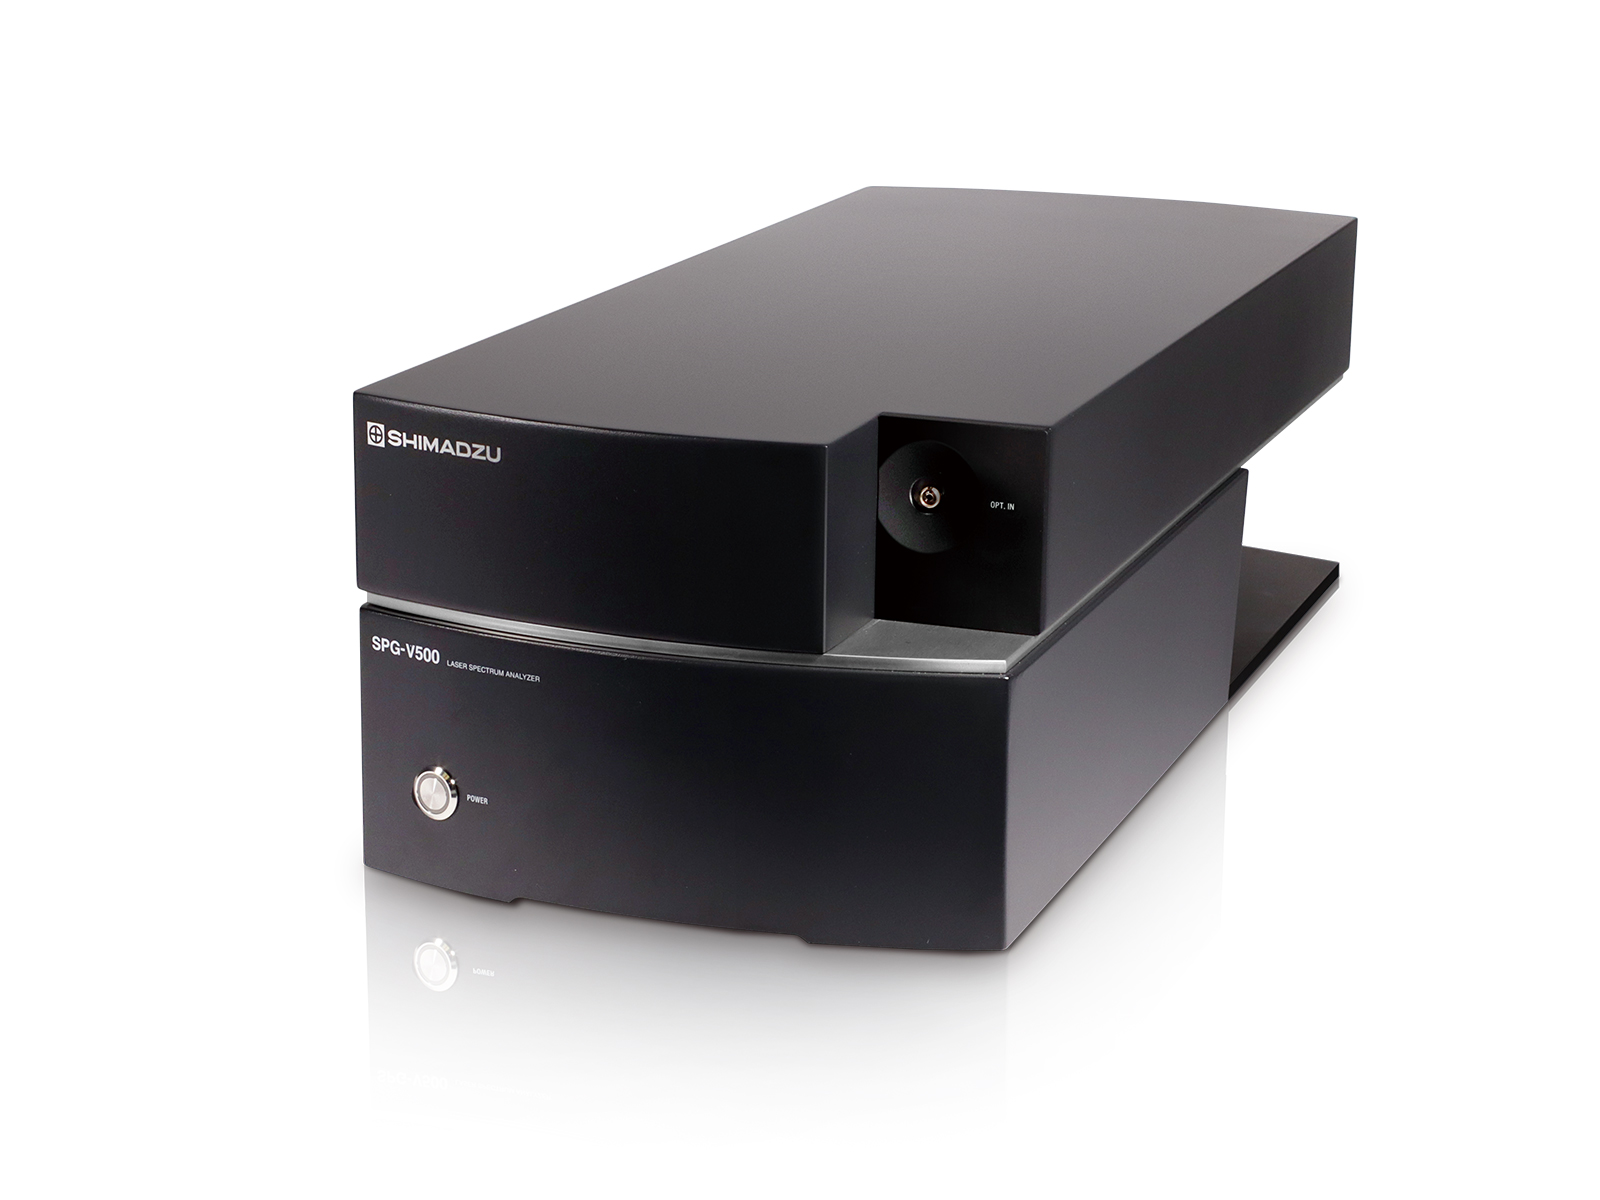
Laser Spectrum Analyzer / SPG
Effectively visualize the behavior of the laser spectrum!
Based on the parameter "Simultaneous Measurement Wavelength Width“, the greatest advantage of this real-time measurement is that spectral data at different wavelengths can be acquired at the same time. Using this method not only shortens the measurement time, but also allows for instantaneous capture of spectral changes, thereby speeding up the development of laser sources and oscillators and reducing manufacturing costs.◆Three Key Features
1) High-resolution real-time measurement Instantaneous photometry at approximately 20pm.
2) Wide wavelength range From 185 to 1095 nm
3) Easy inputEasy input φ600μm multi-mode fiber.
- Dramatically improves the efficiency of oscillator/module assembly and adjustment.
Spectral information during the adjustment process can be visualized to reduce the time required for assembly and adjustment.
The use of optical fibers with a core diameter of 600 µm reduces alignment time. - Spectral behavior evaluation such as mode hops is possible.
The behavior can be visualized by trend graphs and intensity maps. - It is ideal for reliability evaluation of multi-wavelength laser modules.
Automatic storage of multiple wavelength data such as RGB lasers is possible. - Not only single-mode fiber and multimode fiber, spatial light measurement is also possible.
- Optimized software for laser spectrum measurement for ease of use!
Conditions such as "set wavelength and integration time" can be easily set while viewing spectral data, facilitating the progress of measurement. In addition to a spectrum graph that is updated in real time, the system is also equipped with trend graphs, intensity maps, and other functions for visualizing changes over time that are useful in a variety of applications.
 |
 |
 |
 |
| Part Number | SPG-V500-FC | SPG-V500-SMA |
| Optical connector *1 | FC Connectors | SMA Connectors |
| Measurement wavelength range *2, *3 | 185 - 1095 nm | |
| Simultaneous measurement wavelength range *4 | 31.8 - 8.2 nm | |
| Wavelength resolution *5 | 0.04 nm or less | |
| Wavelength accuracy *5*6 | ±0.4 nm | |
| Dimensions and weight | W270 × D650 × H211 mm, 18.7kg | |
| Accuracy Guaranteed Temperature | 23±4 ℃ | |
| Operating temperature and humidity | 23±10 ℃・ 30 - 70 % | |
| Control software *7 | SPG-V500 Measurement Software | |
| Supported OS | Windows®10 Professional (64bit) /Windows®11 Professional Japanese version | |
| Graph Display *8 | Spectral graph, trend graph *9, intensity map | |
| Data analysis | Peak wavelength, half-width, threshold width | |
| Preservation | Spectrum save *10, Continuous save *11, Interval save *12 | |
| Calibration | Origin adjustment *13 | |
| PC Interface | USB 2.0 | |
| Rated power | DC 24V, 1A | |
| Input power | AC100-240V, 2-1A, 50/60Hz | |
| Accessory *14 | AC adapter, USB cable, GND cable, Control software CD *15, Configuration file CD, Instruction manual, Sensor board driver CD | |
*Note
1) Attach an optical fiber cable (sold separately) that meets each specification. Recommended core diameter is 200 to 600 μm. This system supports laser light input of up to 10 mW.
2) The setting wavelength range is 190 to 1092 nm. The set wavelength is the wavelength measured near the center of the sensor.
3) Use an order separation filter if the measurement light includes light with a wavelength that is an integer fraction of the measurement wavelength.
4) Wavelength width that can be measured in real time. It is determined for each set wavelength.
5) The test wavelengths are 253.7 nm, 546.1 nm, 912.3 nm, and 1092.1 nm. Values are around the center of the sensor.
6) Values after using the origin adjustment function of the software.
7) No condensation, dust, or vibration.
8) The reference function allows you to check the spectrum graph of the specified spectrum storage data.
9) You can select from peak count value, sum of count values, number of peaks, half width and center wavelength of Gaussian fitting curve (RMS method).
10) Function to manually save a single spectrum data (csv format, extension: dat). Spectral graph image data (PNG format) can also be saved.
11) Function to automatically save up to 10000 consecutive data (csv format, extension: dat).
12) Function to save up to 10 conditions and up to 1000 times of data per condition at specified intervals (10 to 1000 s) (csv format, extension: dat).
13) Origin adjustment is performed automatically when the white light source is incident and the integration time is adjusted.
14) PC and optical fiber cable are sold separately.
15) DLL (C#) and sample software (C#, Python) are included to control the device from your software.